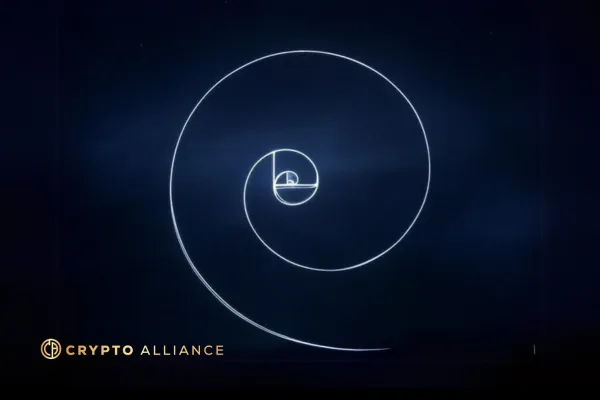
Trading with Fibonacci
Before we unravel the intricacies of Fibonacci levels in trading, let's uncover what these levels are and why they're considered almost magical in the trading world.
Fibonacci numbers stem from a mathematical sequence where each number is the sum of the two preceding ones, starting from 0 and 1. This sequence creates ratios that occur frequently in nature, art, and architecture. Traders have adapted these ratios to predict financial markets' behavior, identifying key support and resistance levels.
Key Fibonacci Ratios

Shankar depicting the most commonly used Fibonacci ratios.
In trading, the most commonly used Fibonacci ratios are 0.382 and 0.618. These are derived from dividing elements of the Fibonacci sequence:
For example, 34 divided by 55 gives approximately 0.618.
Moving two places forward in the sequence, 34 divided by 89 results in approximately 0.382.
These ratios help traders determine entry and exit points, aiming to "buy low, sell high."
"Fibonacci levels are mysterious but powerful tools, respected by many in the trading world." - Shankar Poncelet
The Role of Fibonacci in Crypto Trading
The rise of cryptocurrency has added a layer of intrigue to Fibonacci levels. As decentralized finance became popular, professionals began relying on these levels to navigate the volatile crypto market.
Why Fibonacci Levels Resonate in Crypto
There might be a self-fulfilling prophecy at play here. As more traders use Fibonacci levels to make decisions, their collective actions can cause the market to behave in ways that respect these levels. This phenomenon is particularly noticeable with the advent of automated trading systems and AI-driven algorithms, which often incorporate Fibonacci ratios into their decision-making processes.
Practical Application: Exploring Solana with Fibonacci
Let's bring theory into practice by examining how Fibonacci retracement levels apply to real-world trading. We'll use a popular cryptocurrency like Solana as our example.
Setting Up the Chart
Select the Time Frame: For a comprehensive analysis, consider a long-term timeframe, such as five years, to observe the overall price movement.
Identify Key Levels: Plot the Fibonacci retracement tool from the highest to the lowest price point.
Understanding the Boxes
When analyzing Solana's chart, we can categorize price movements into phases represented by boxes:
Box A: Early Adopters
Box B: Bull Run Momentum
Box C: General Market Participation
"These boxes, guided by Fibonacci levels, help traders navigate through different market phases." - Shankar Poncelet
By drawing these boxes, we can better visualize market trends and potential profit-taking opportunities.
Fibonacci in Action: A Case Study with Trump Meme Coin
To illustrate the versatility of Fibonacci levels, let's examine another example with the Trump meme coin.
Drawing Fibonacci Levels
Select the Time Frame: Choose a shorter timeframe, like one month, suitable for highly volatile assets.
Identify Key Swings: Use the Fibonacci retracement tool to mark the significant high and low points on the chart.
Observing Market Behavior
Interestingly, the Fibonacci levels in this case reflect significant support and resistance zones, where price movements tend to stabilize or reverse. This provides traders with strategic points for potential entry and exit.
Embracing Technical Analysis for Successful Trading
Mastering Fibonacci levels is just one piece of the broader technical analysis puzzle. Whether you're trading popular coins like Solana or meme coins like the Trump coin, technical analysis provides invaluable insights into market dynamics.
Tips for Incorporating Fibonacci Levels
Start with Charting Tools: Platforms like TradingView offer Fibonacci retracement tools; experiment with them to understand their impact.
Combine with Other Indicators: Use Fibonacci levels alongside other technical indicators to enhance trading strategies.
Stay Informed: Keep up with market trends and news that may influence crypto prices, ensuring your trading decisions remain informed.
"Incorporating Fibonacci levels into your trading strategy can unlock new opportunities and provide clarity in volatile markets." - Shankar Poncelet
Looking Ahead: The Future of Trading with Fibonacci
As cryptocurrencies continue to rise, traders must adapt to new strategies and tools. Fibonacci levels remain a staple in the toolbox of many savvy investors and can be a game-changer for those willing to learn and adapt.
Whether you're a seasoned trader or just starting, understanding Fibonacci levels can give you that golden edge. The power lies not just in the numbers themselves, but in the collective behavior of those who believe in them.
This is for informational purposes only and is not financial advice. Always do your own research and consult a professional before making any trading decisions.
For an in-depth look at these possibilities and to stay connected with cryptocurrency, join my mailing list at crypto.lifestyle.
Here's to a future where digital freedom meets meaningful change.

